Financial Capital

Strengthening our Financial Foundation

Prudent allocation and management of financial capital lays a solid foundation for CAMS to enjoy consistent growth and retain its market leadership year after year. A future-focussed strategy, combined with disciplined fund management, drives agility and resilience while cementing our reputation as a reliable brand.

CAMS delivered a robust financial performance during the year underpinned by stable yields, a debt-free balance sheet and resilient operating free cash flows. Sustained growth was registered in core MF business while non-MF revenues grew considerably, driven by product innovation, platform leadership, and a focussed roadmap. Our margins remained healthy, backed by disciplined cost management and scale benefits, automation, and process optimisation.

To ensure long-term growth and stability, we reinvest a portion of our profits towards technology enhancements and process automation. Significant financial resources were allocated towards the adoption of latest technologies and their integration into our operations, enhancing cost and process efficiencies, improving data security, and elevating consumer experience. Our technological capabilities were further augmented through the acquisition of fintech companies in recent years.

Collectively, these elements reinforced the strength of our financial capital, positioning us well to withstand market uncertainties, capitalise on emerging opportunities and create sustainable stakeholder value.

SDG's Impacted

SDG 8 SDG 17

Material Priorities

Financial Performance

Risks

Risk
39.03% Return on Networth
No External Debt Balance Sheet
45.11% EBITDA Margin
854.45 Crore Cash & Cash Equivalent

Key Financial Highlights

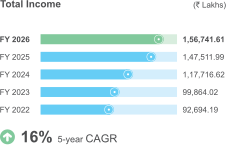
Total Income (₹ Lakhs) — FY 2026: 1,56,741.61 | FY 2025: 1,47,511.99 | FY 2024: 1,17,716.62 | FY 2023: 99,864.02 | FY 2022: 92,694.19 | 16% 5-year CAGR
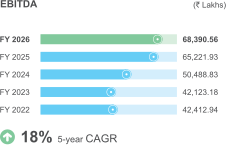
EBITDA (₹ Lakhs) — FY 2026: 68,390.56 | FY 2025: 65,221.93 | FY 2024: 50,488.83 | FY 2023: 42,123.18 | FY 2022: 42,412.94 | 18% 5-year CAGR
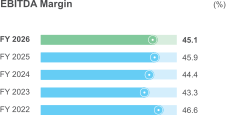
EBITDA Margin (%) — FY 2026: 45.1 | FY 2025: 45.9 | FY 2024: 44.4 | FY 2023: 43.3 | FY 2022: 46.6
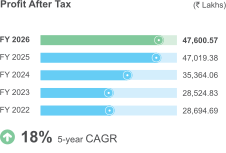
Profit After Tax (₹ Lakhs) — FY 2026: 47,600.57 | FY 2025: 47,019.38 | FY 2024: 35,364.06 | FY 2023: 28,524.83 | FY 2022: 28,694.69 | 18% 5-year CAGR
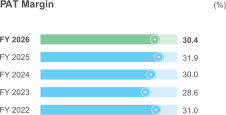
PAT Margin (%) — FY 2026: 30.4 | FY 2025: 31.9 | FY 2024: 30.0 | FY 2023: 28.6 | FY 2022: 31.0
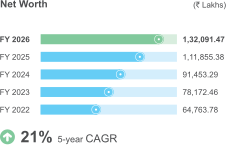
Net Worth (₹ Lakhs) — FY 2026: 1,32,091.47 | FY 2025: 1,11,855.38 | FY 2024: 91,453.29 | FY 2023: 78,172.46 | FY 2022: 64,763.78 | 21% 5-year CAGR
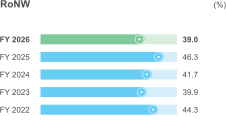
RoNW (%) — FY 2026: 39.0 | FY 2025: 46.3 | FY 2024: 41.7 | FY 2023: 39.9 | FY 2022: 44.3
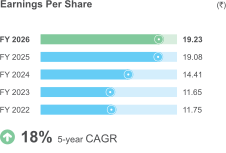
Earnings Per Share (₹) — FY 2026: 19.23 | FY 2025: 19.08 | FY 2024: 14.41 | FY 2023: 11.65 | FY 2022: 11.75 | 18% 5-year CAGR
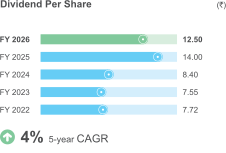
Dividend Per Share (₹) — FY 2026: 12.50 | FY 2025: 14.00 | FY 2024: 8.40 | FY 2023: 7.55 | FY 2022: 7.72 | 4% 5-year CAGR
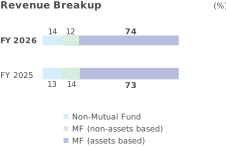
Revenue Breakup (%) — FY 2026: Non-MF 14, MF non-assets 12, MF assets 74 | FY 2025: Non-MF 13, MF non-assets 14, MF assets 73
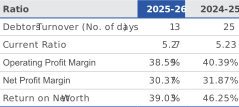
Ratio Table — Debtors Turnover: 13 days (2025-26), 25 days (2024-25) | Current Ratio: 5.27 / 5.23 | Operating Profit Margin: 38.59% / 40.39% | Net Profit Margin: 30.37% / 31.87% | Return on Net Worth: 39.03% / 46.25%